Visual Debugging with Eclipse and IDEA
The new version (1.2) of the HTML/Java APIs is already on Maven Central, and you should start using it right now. There is now an easy way to enable Firebug in the General Client for visually debugging the app. I made a little video to demonstrate this.
If you’re running the application from IDEs other than NetBeans you missed out on some great features for debuging your app. But now we’ve added firebug-lite, so you have a nice replacement. You can activate this feature by adding a line to the configuration of the maven exec plugin in the pom.
<plugin>
<groupId>org.codehaus.mojo</groupId>
<artifactId>exec-maven-plugin</artifactId>
<version>1.2.1</version>
    <configuration>
	<executable>${exec.java.bin}</executable>
	<classpathScope>test</classpathScope>
	<arguments>
		<argument>-classpath</argument>
		<classpath />
		<argument>-javaagent:${project.build.directory}/springloaded.jar</argument>
		<argument>-noverify</argument>

		<argument>-Dfirebug.lite=true</argument>

		<argument>-Dbrowser.rootdir=${basedir}/src/main/webapp/</argument>
		<argument>-Dnetbeans.inspect.port=${netbeans.inspect.port}</argument>
		<argument>${exec.debug.arg}</argument>
		<argument>${project.mainclass}</argument>
	</arguments>
    </configuration>
</plugin>
The toolbar has an additional button to start “firebug-lite”. This will allow you to do visual DOM inspection very similar to what is possible in NetBeans.
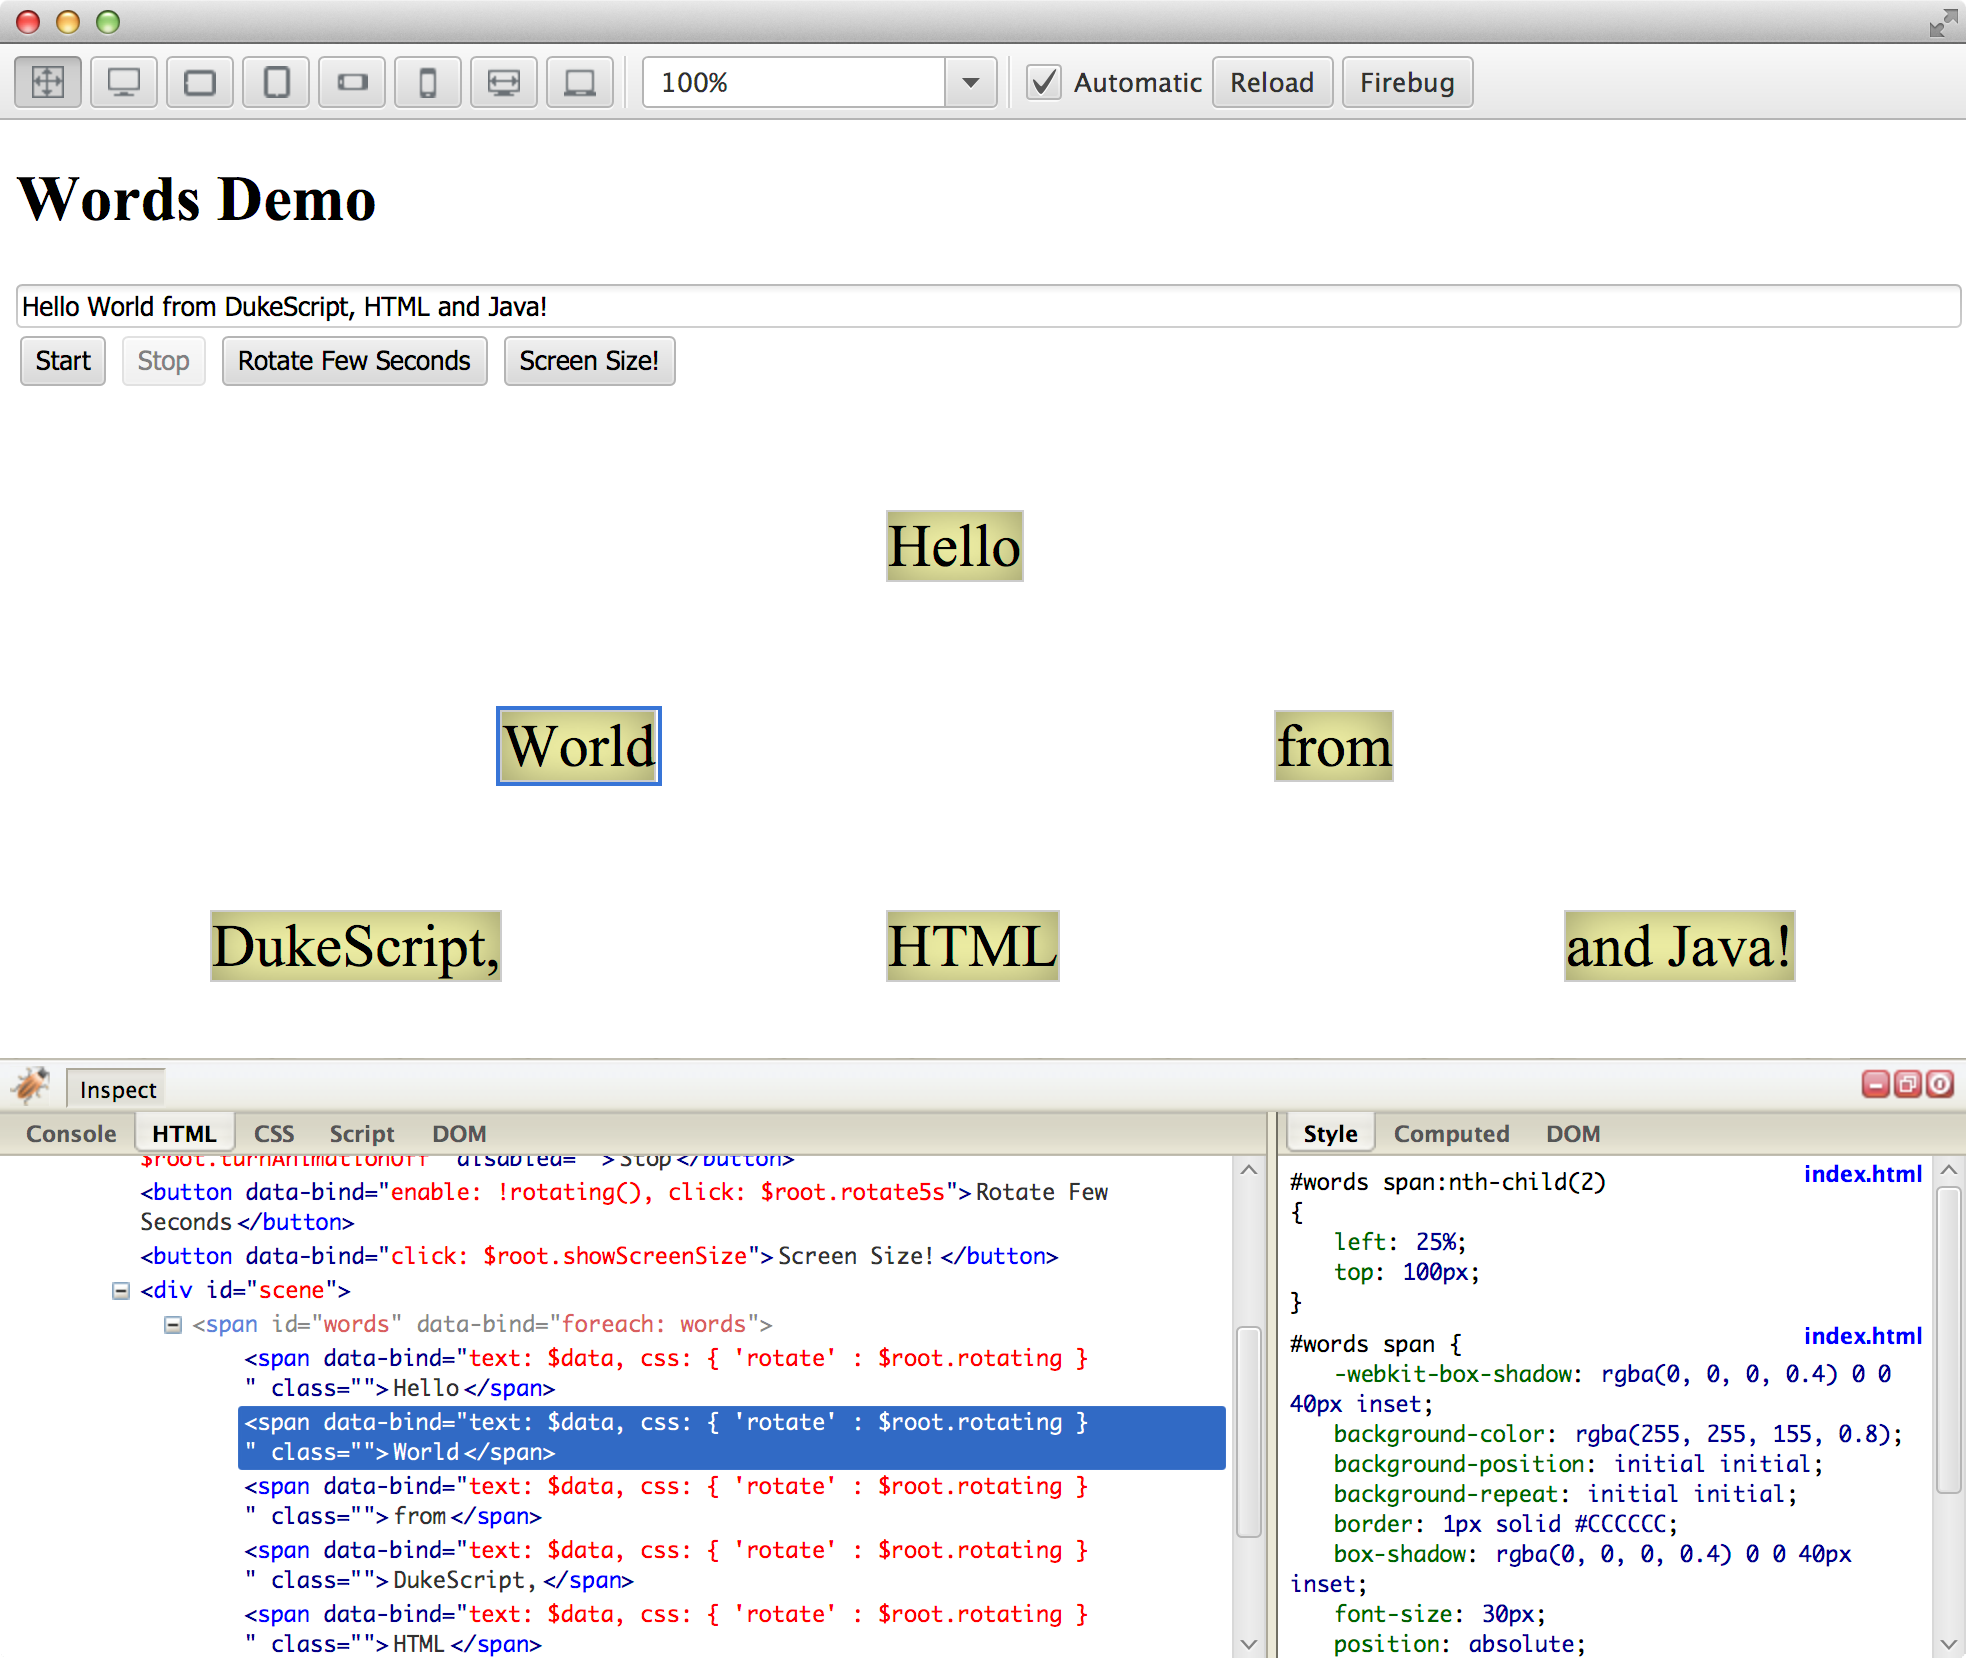
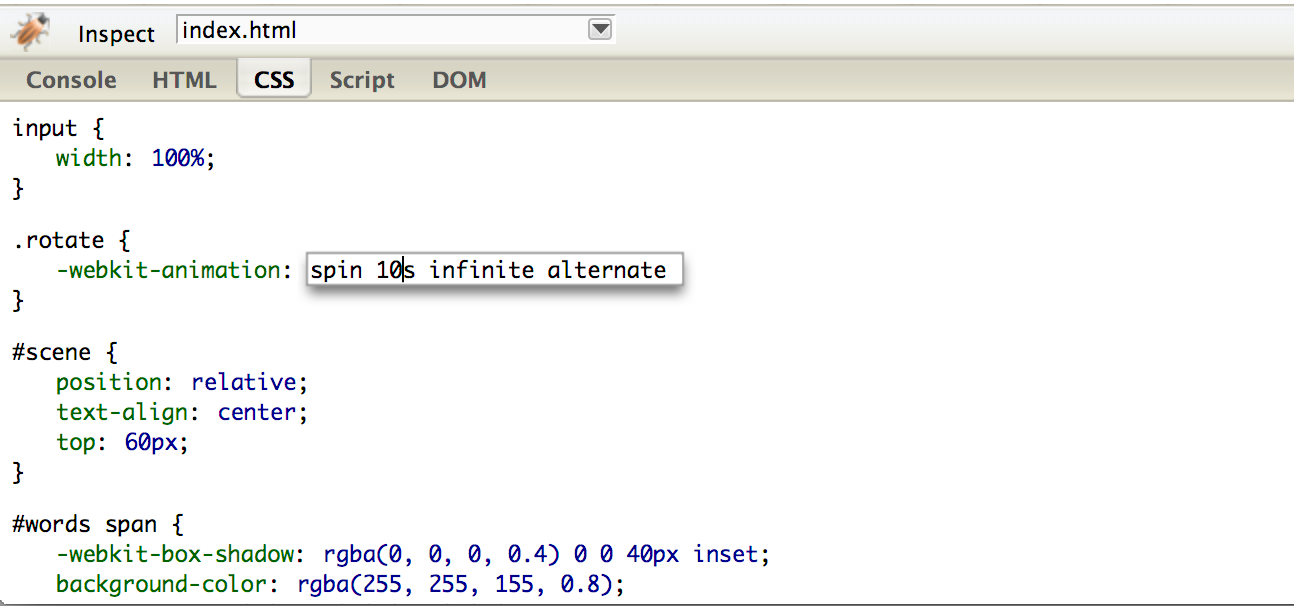
Click the “Inspect” button to activate live inspection mode. Now you can hover over the elements and the HTML-tab will show you the active element in the live DOM tree. In the CSS-tab you can manipulate the property values to test alternative values. In our example you can change the speed of the animation by setting a new value.
In the next post I’ll explain how to inspect knockout models with this.