Line Charts & more for Java
Including nice looking charts in your Java application has never been easier! DukeScript visual archetype 0.16 (and newer) gives you absolutely smooth start - just a few clicks in the IDE or shell commands and you are ready to use for example a line chart in your JavaFX, Android, NetBeans Platform or iOS applications.
Explore
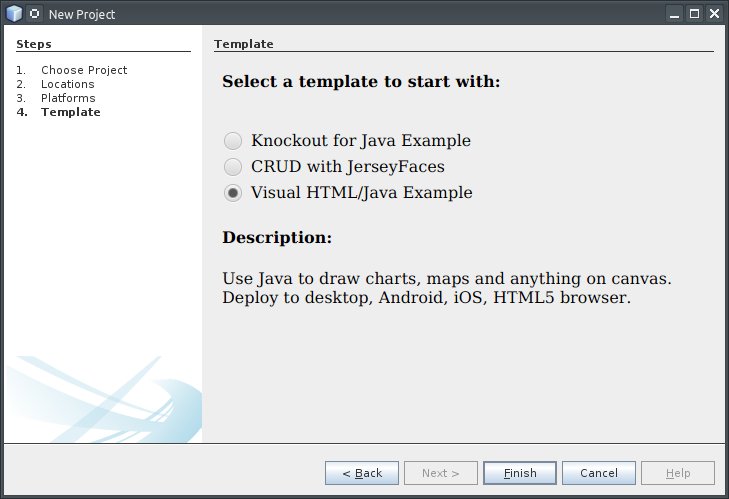
Follow the getting started tutorial and on archetype selection panel choose visual archetype:
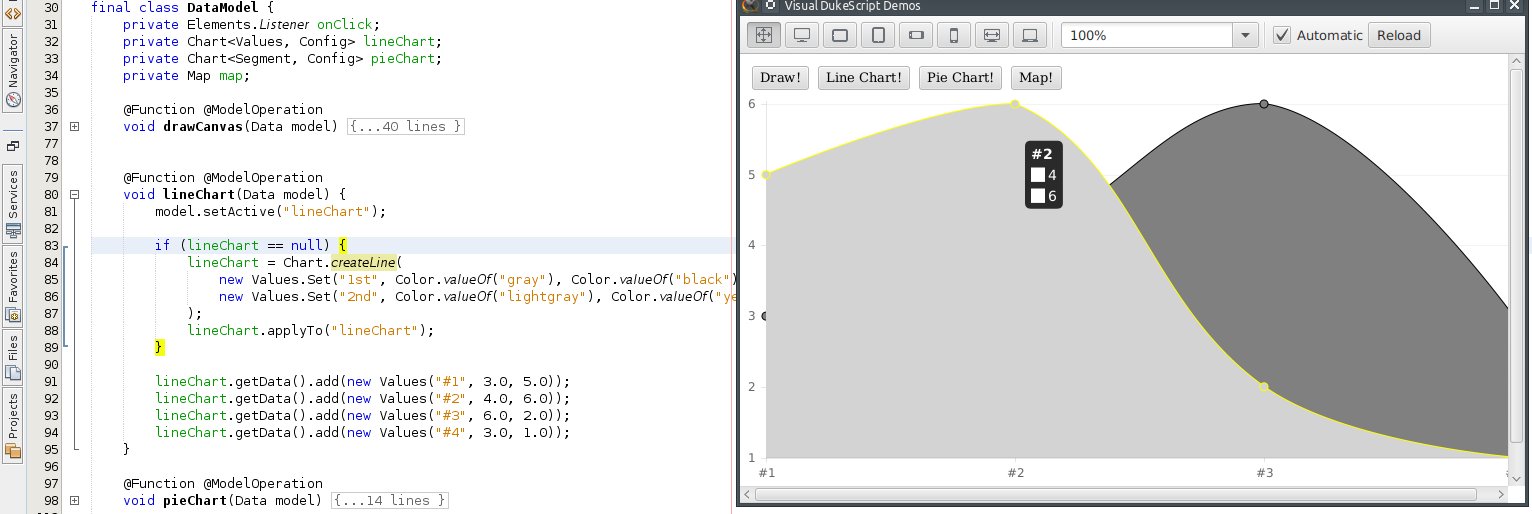
Once the project is generated and DataModel.java class opened in the editor, you can locate the lineChart function and check what it does. Then you can execute the project. Once you click “Line Chart!” button, the lineChart method is executed and line chart graph is shown:
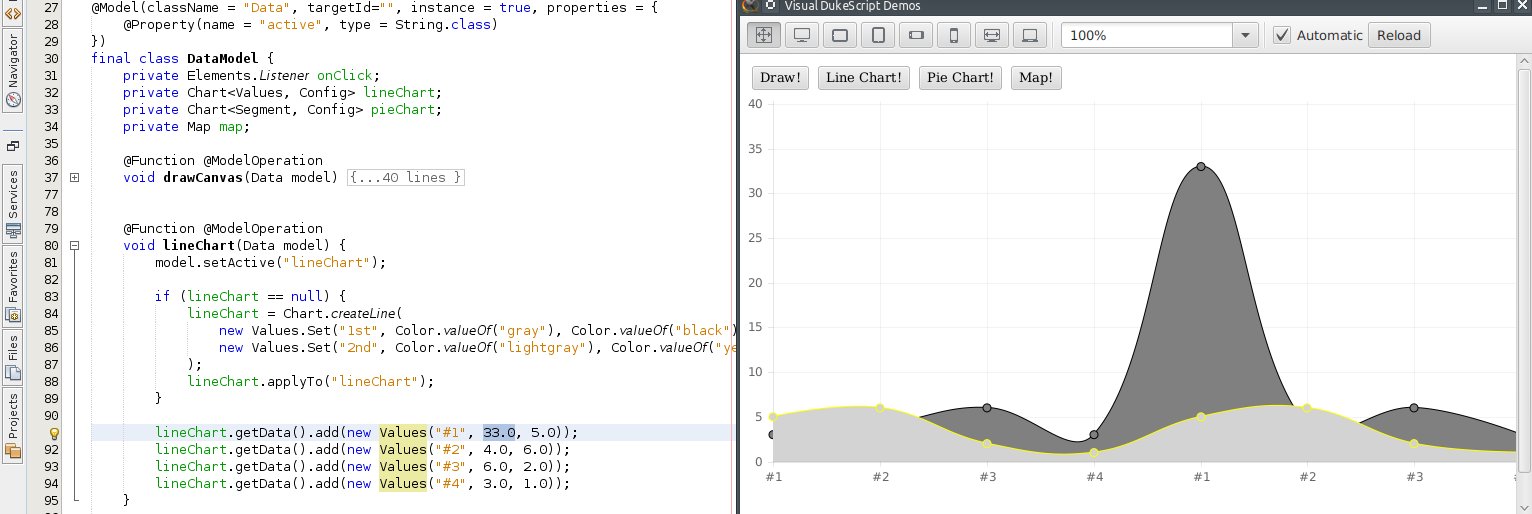
Now you can use the no redeploy features of DukeScript and change code in the lineChart method. For example modify the values to be drawn at the chart. Once you save and click the “Line Chart!” button again your changes shall be immediatelly applied and visible:
This is a handy way to explore the Charts API and interactively play with it.
Embed
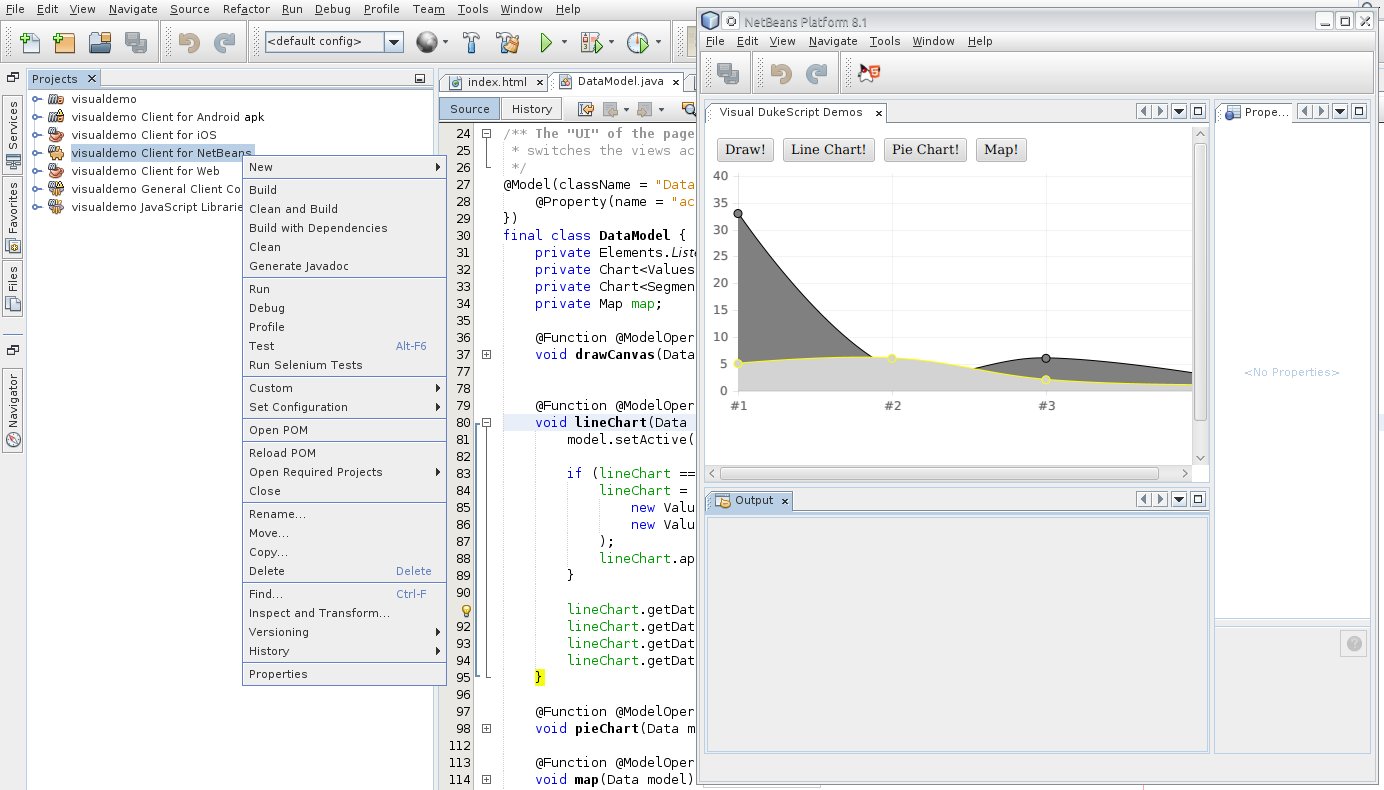
Once your sample is working you can include your chart in any Java application: Let it be JavaFX, Android, etc. For example adding such nice charts into your NetBeans Platform application is a matter of pressing the “Run” button on the generated (if you selected such option in the wizard) project:
Embedding into JavaFX application is simple as well. Using great looking charts from Java has never been easier!
Command Line Usage
Last, but not least: you can follow the same tutorial without the need to start NetBeans IDE. Just type this on command line:
$ mvn archetype:generate
	-DarchetypeGroupId=com.dukescript.archetype
	-DarchetypeArtifactId=visual-archetype
	-DarchetypeVersion=0.18
$ cd generateddir
$ mvn install
$ mvn -f client exec:exec
The behavior of your project shall remain the same, including the no redeploy features and other DukeScript goodies.